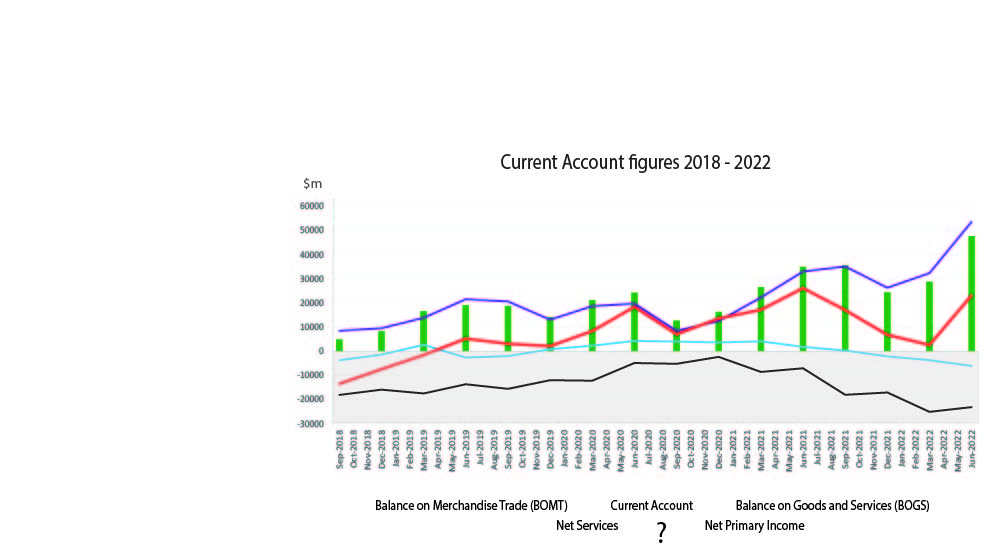
Activity 7g: Current account stats

Purple line: Balance on Merchandise Trade
Red line: Current account balance
Blue line: Net Services
Black line: Net Primary Income
Green bars: Balance on Goods and Services
- Any increase in the BOMT should (ceteris paribus) lead to a similar increase in the BOGS, given that the BOMT is the major component of the BOGS. Similarly, an increase in Net Services should also lead to an increase in the BOGS (assuming there has been no change in the BOMT) given that Net Services is the remaining component of the BOGS. The movement in the BOGS should contribute to a similar movement in the current account, such that an improvement in the BOGS (e.g. a larger surplus) contributes to an improvement in the CA (larger surplus or lower deficit). This is because the NPI section of the CA is a relatively stable (albeit largest) component of the CA and any volatility in the CA is typically consistent with volatility in the BOGS.
- An increase in these commodity prices (which should contribute to an increase in the TOT) will lead to an increase in net X values, which should lead to an increase in the BOMT surplus (or reduction in the deficit), which in turn leads to an increase in the BOGS and an increase in the CA surplus.
- Given that the red line represents the current account balance, it’s move above zero in the middle of 2019 reflects that the current account moved from a deficit to a surplus. This was driven primarily by the huge growth in net exports which led to a large increase in the Balance on Goods and Services.
- Since the early part of 2019, the black line (i.e. net primary income) trended upwards from a deficit of approximately $15 billion to a deficit of approximately $5 billion. Lower global interest rates were a major contributing factor given that lower rates of interest reduced the servicing costs related to foreign debt which in turn led to relatively fewer (net) interest debits flowing through the net primary income section of the current account.
